


To expand the verification possibilities and support the quality control of high-performance cables (data transmission cables, aeronautical cables, coaxial cables, etc.), WTM has developed a special signal processing and analysis software completely integrated into the machine. This software is complementary to the WTM Visio System, capable of collecting a pictures of the cable for each rotation of the taping head.
WTM can offer different software packages:
- Basic software with magnifying and measurement functions;
- SPC package software (option);
- FFT package software (option);
- Spectrogram (option);
The Basic software is supplied with the Visio System: the user can take advantage of the magnifying function and automatic measurement features.
The SPC package allows to perform the Statistical Process Control and the analysis on the measures of the taping pitch collected by the system. It is applied on aeronautical and aerospace cables, coaxial and data cables, control cables insulated in PTFE, polyimide, polyester, etc.
The FFT package implements the Fast Fourier Transformation on the data set collected by the Visio System and allows to perform the frequency analysis on the measurements of the taping pitch. This solution is recommended for high frequency data cables (coaxial, bi-coaxial) shielded with silver-plated copper tape, alu-polyester tape, etc.
Magnifying function
It is used to visually check the enlarged taping process on the screen during the manufacturing process. Like a magnifying glass with special illumination, it allows for better visual detection of cable defects.
Measurement function
It is complementary to the magnifying function, it is used for continuous multi-frame data collection. The measurement is managed online on each taping pitch.
SPC package software (option)
The SPC package adds a data monitor, that displays the data trends of the acquired measures.
The system also allows the extraction of statistical information from the data in real time, with possibility to represent it as a Gaussian curve.
Moreover, this software package allows the computation of Cpk index over the measures collected and its inspection by trending.
FFT package software (option)
The FFT package adds an additional plot showing the frequency representation of the signal.
This type of representation provides more detailed information about the process, and can help to identify anomalous behaviour on the machine setting or on product selection (cores, cables, tapes, etc).
The peaks in the curve correspond to periodic phenomena of the signal (for example the perturbation of the rotation of a motor or others).
By allowing the visualization of unexpected frequency peaks, this graph can be used to identify mechanical resonance that can be responsible of the faults on electrical frequency of the high frequency signals.
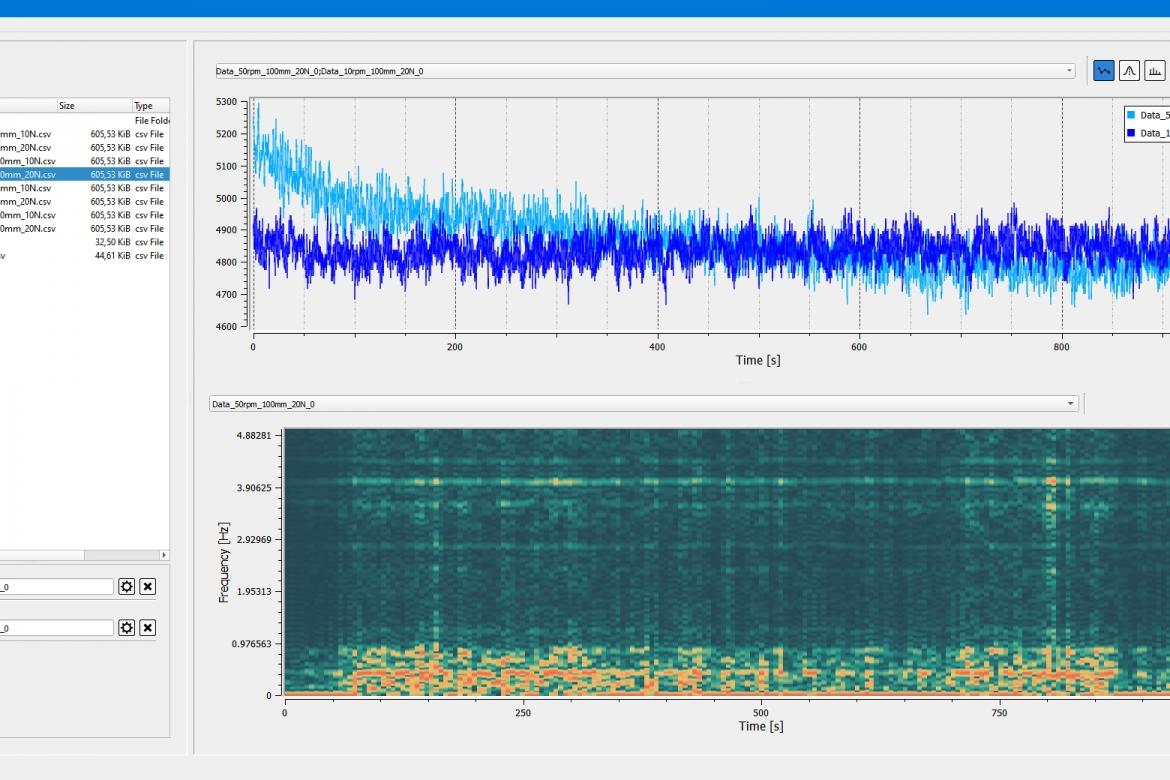
Spectrogram (option)
The spectrogram shows the trend of the frequency analysis over time.
This 3-dimensional graph shows:
- the time on the horizontal axis
- the frequency on the vertical axis
- the intensity as a colour scale with which the graph is painted
The spectrogram allows to analyse the behaviour over time of the periodic phenomena highlighted by the frequency analysis, providing even richer information on the analysed signal.
The technical characteristics can be customized according to the specific production requirements of the Customer.
Request further information or a custom-made quotation now!
The technical characteristics can be customized according to the specific production requirements of the Customer.
Request further information or a custom-made quotation now!
Information Request